
Skip to Main Content
Hands in the air celebrating in front of confetti on stage

West of England
Data Lab

We're using data to strengthen our understanding of the West of England, and to shape the region's future

See how we're progressing in delivering against the region's Growth Strategy, explore the underlying data, and find out how we're building new insights to support targeted project delivery.

The West of England Data Lab is developing new ways to use data to improve our services for residents. We have an ambitious and innovative plan to build and share our evidence, and will update this page with new data when available.

The baseline figures for our Growth Strategy targets

0.7% employment growth in advanced manufacturing, digital & technology, and creative 2023 to 2024
6000 new jobs across a range of sectors 2023 to 2024
26.7% 10-year GDP growth rate (2013-2023)
4398 Increase in homes Mar 2024 to Mar 2025
45% of commuting journeys by active travel and public transport 2023 to 2024
24mw new clean energy capacity installed 2023 to 2024

Note: Available statistics do not yet cover the period since the Growth Strategy was launched.

Access datasets, insights and tools

Image credit: B&NES

Explore our annual reports on the main strengths and challenges in the region

cyclist crossing road

Discover the impact of our work

Image credit: Freia Turland

Access headline data for each of our 70+ regional indicators

person works at a tablet
Navigate the wide range of datasets we have made available
person making notes from a laptop

Explore trends and analysis on key economic factors in the region

Kingfisher on a green background

See the latest data and thinking on the region's nature and environment

Our economy in graphs
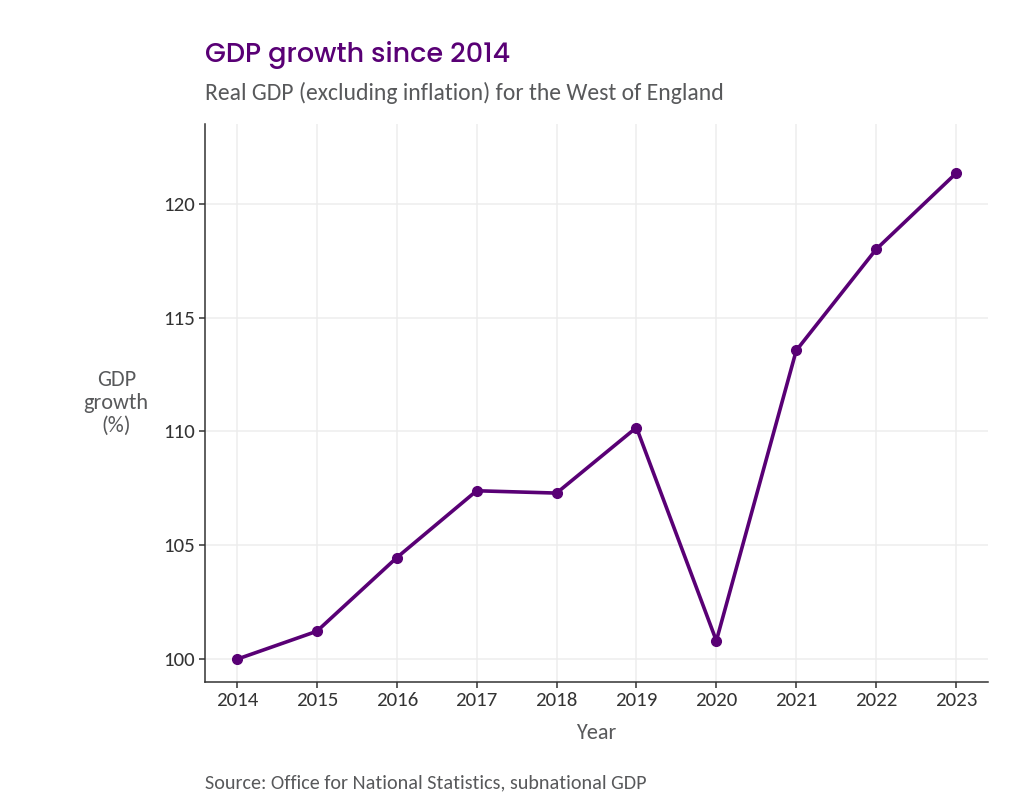
GDP growth since 2014: Line chart of real GDP for the West of England, indexed to 2014 = 100, annual 2014 to 2023. Index rises steadily to 110 in 2019, falls sharply to 101 in 2020, then rises to 121 by 2023.
Total slide out 1 of 4
GDP growth since 2014

Real GDP rose 21% between 2014 and 2023, falling sharply in 2020 before recovering past its pre-2020 level by 2021. From 2020, regional GDP has grown by 6.4% a year versus the UK average of 4.5% a year
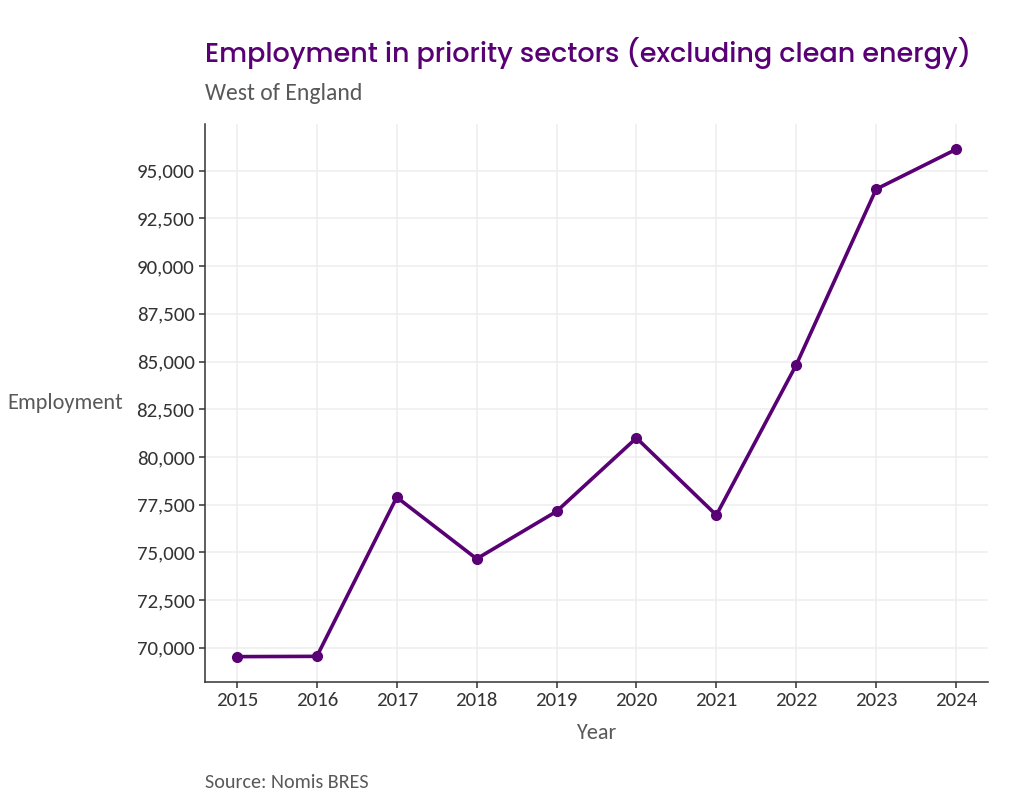
Employment in priority sectors: Line chart of employment in priority sectors excluding clean energy, West of England, annual 2015 to 2024. Employment holds flat at around 69,500 in 2015 and 2016, jumps to 77,900 in 2017, dips to 74,700 in 2018, and then rises overall to 96,100 in 2024, with a smaller dip in 2021.
Total slide out 2 of 4
Employment in priority sectors

Employment in the region's Advanced Manufacturing, Digital and Technology, and Creative Industries grew from 70,000 in 2015 to more than 95,000 in 2024. 10% of the region's jobs are in Digital and Technologies and 6% in the Creative Industries, significantly more than the employment share for these industries at the national level.
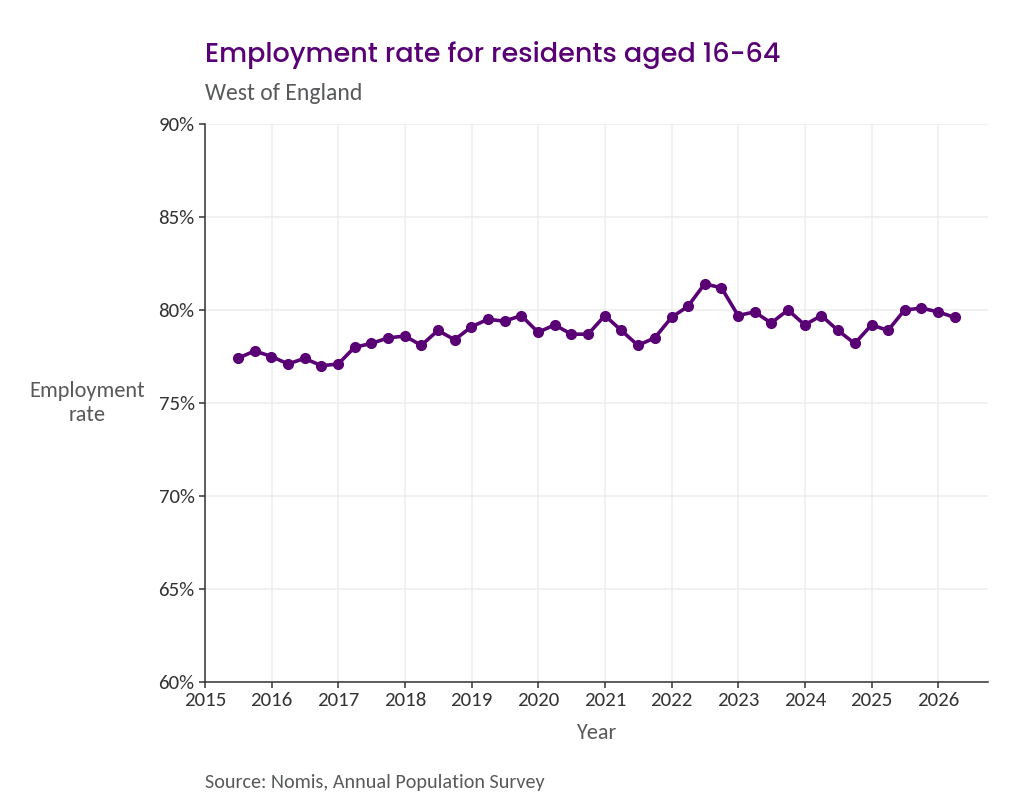
Employment rate: Line chart of the employment rate for residents aged 16 to 64 in the West of England, quarterly rolling-year figures from mid-2015 to early 2026. Rate rises from 77.4% to a peak of 81.4% in mid-2022, then eases back to 79.6% by the end of the series, fluctuating throughout.
Total slide out 3 of 4
Employment rate for residents aged 16-64

Employment rose from 77.4% in 2015 to a peak of 81.4% in mid-2022, then eased back to 79.6% by early 2026. 53% of residents in the West of England held a Level 4 qualification or above (a higher education qualification beyond A Levels), compared with 48% nationally. More than 110,000 students attend the region's four universities.
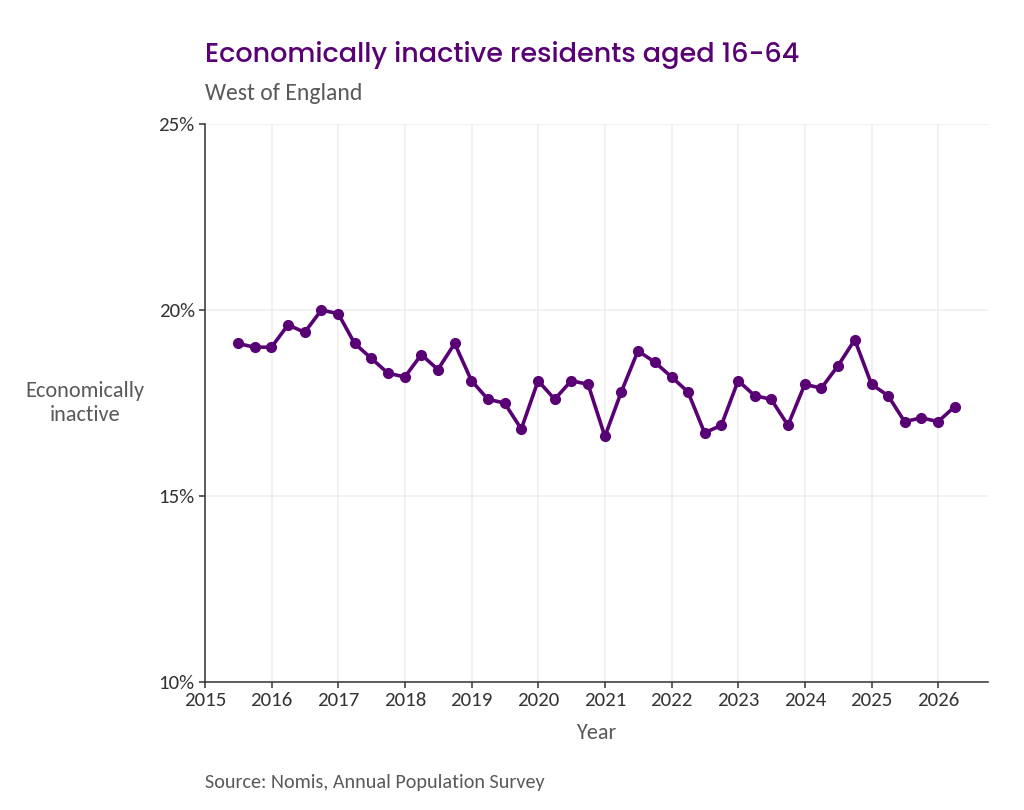
Economic inactivity peaked in 2017 at 20% and has dropped to around 17% in 2026. This is almost 4% lower than the national rate.

Total slide out 4 of 4
Economically inactive residents aged 16-64

Economic inactivity peaked in 2017 at 20% and has dropped to around 17% in 2026. This is almost 4% lower than the national rate.

Key figures for areas of the West of England

Open map in a new window